Inspired by Pierre Buttin’s Day on a device, for the last year I was taking a screenshot every minute in order to visualize my computer use. I used a Python script and cron, taking screenshots for a user account that I don’t use for client work.
I wanted to create one full size image per day. I cut a two-pixel-tall strip from each screenshot and positioned it accordingly to when it was taken: 00:00 at the top, 12:00 in the middle, 23:59 at the bottom, etc.
I knew in advance these images would be mostly empty and boring. As I’ve learned from this experiment, my median weekday computer time is 2 hours 18 minutes. (To be precise, it’s how long the screen is on. I’m not always in front of it.) However, I also knew that on weekends I sometimes spend significant amount of time behind a keyboard. That’s when I hoped to get cool-looking glitchy data art.
I’m slightly disappointed that after a year I got only about a dozen of images that look compelling. Below are my favourite three.
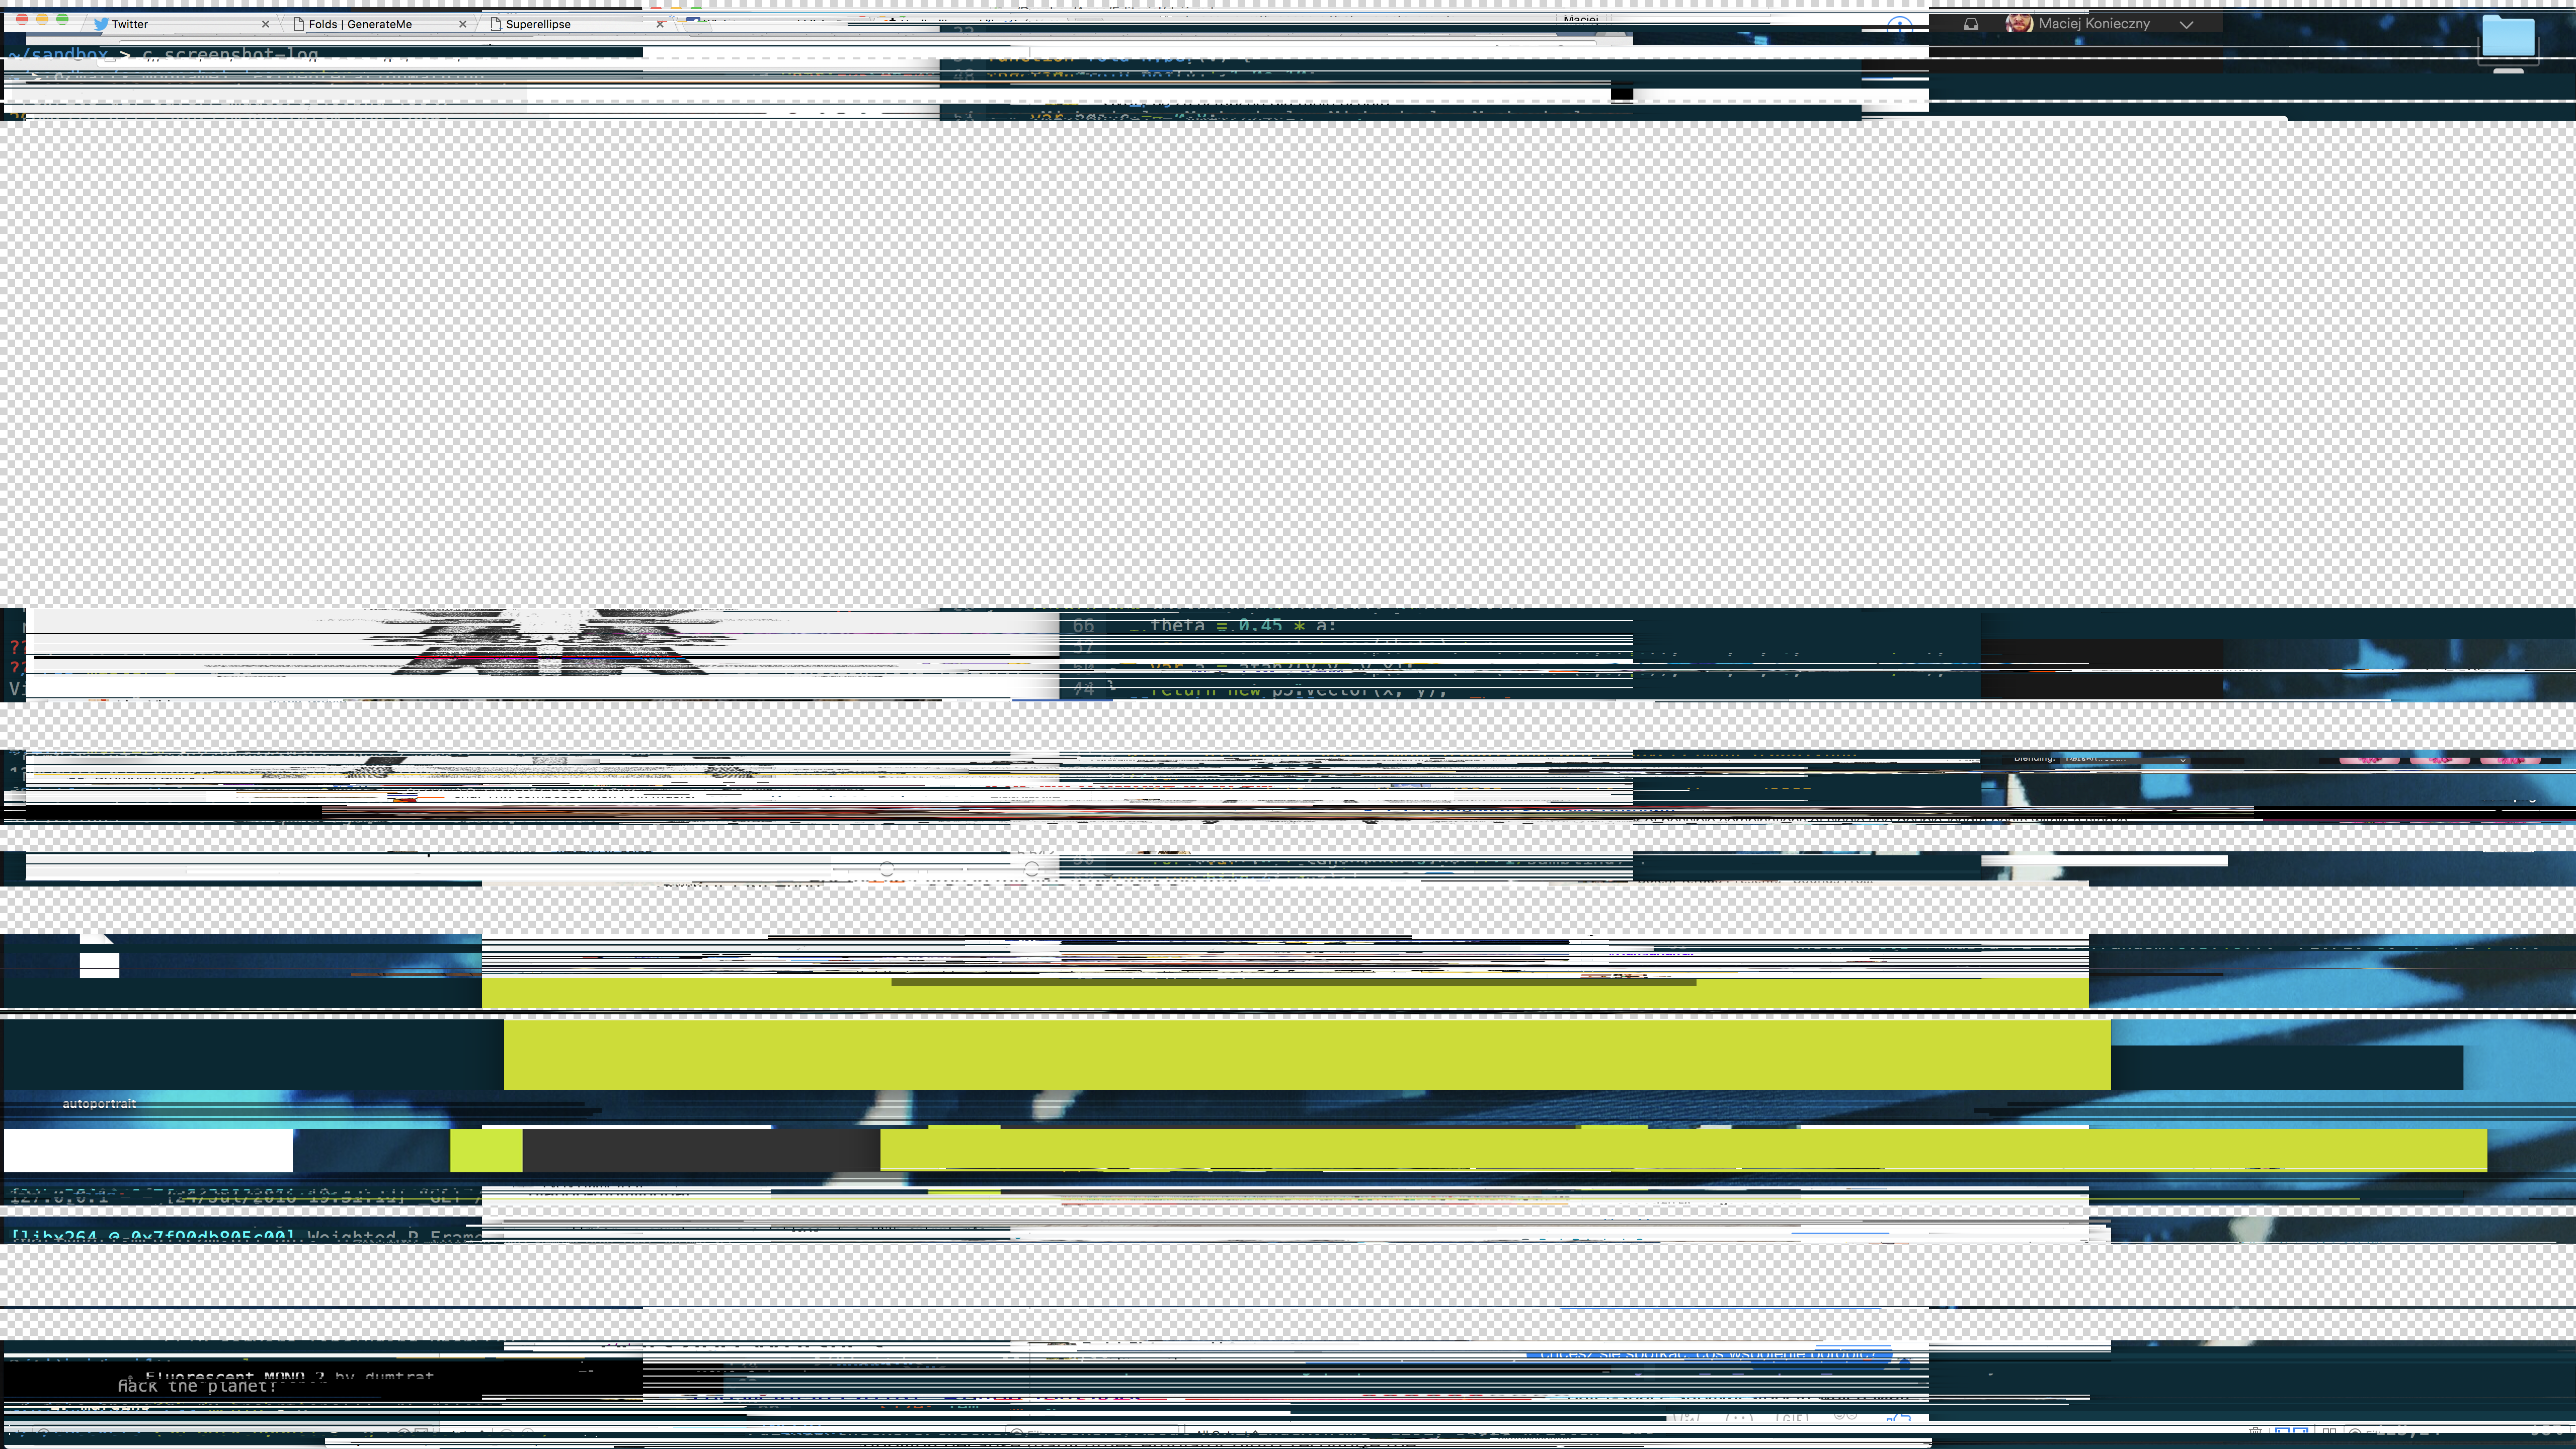
p5 and bytebeat
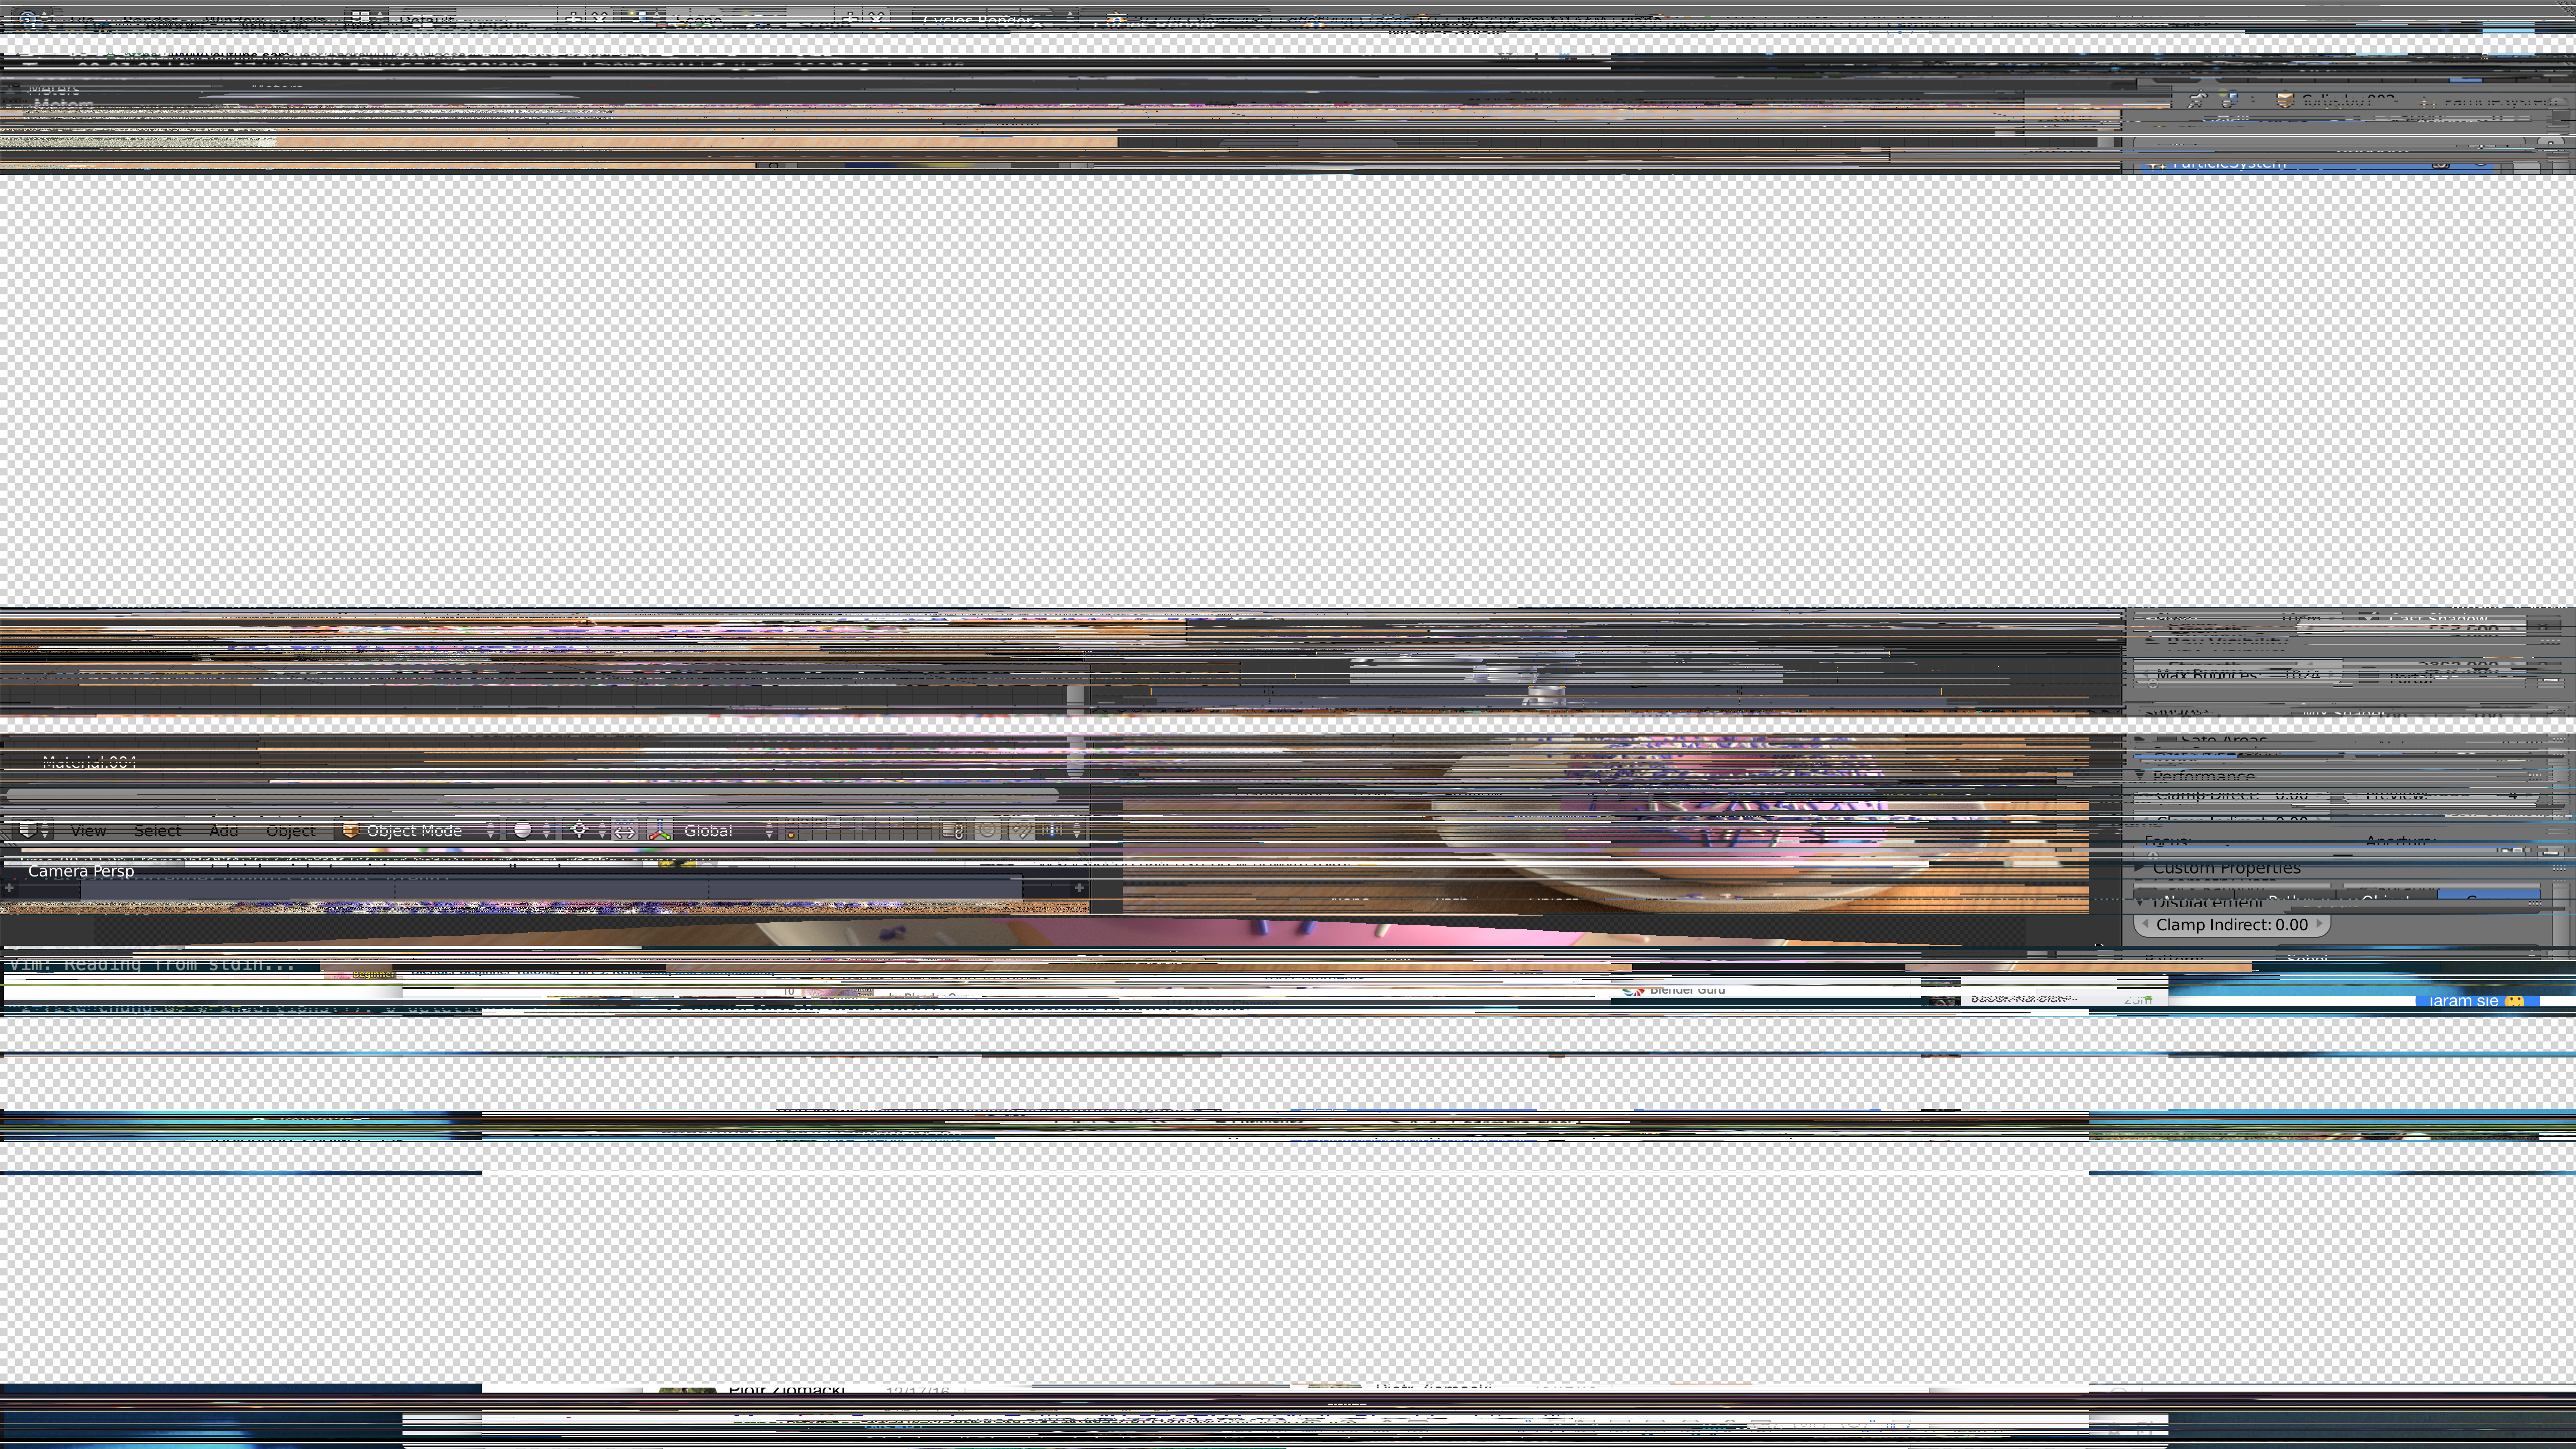
Blender
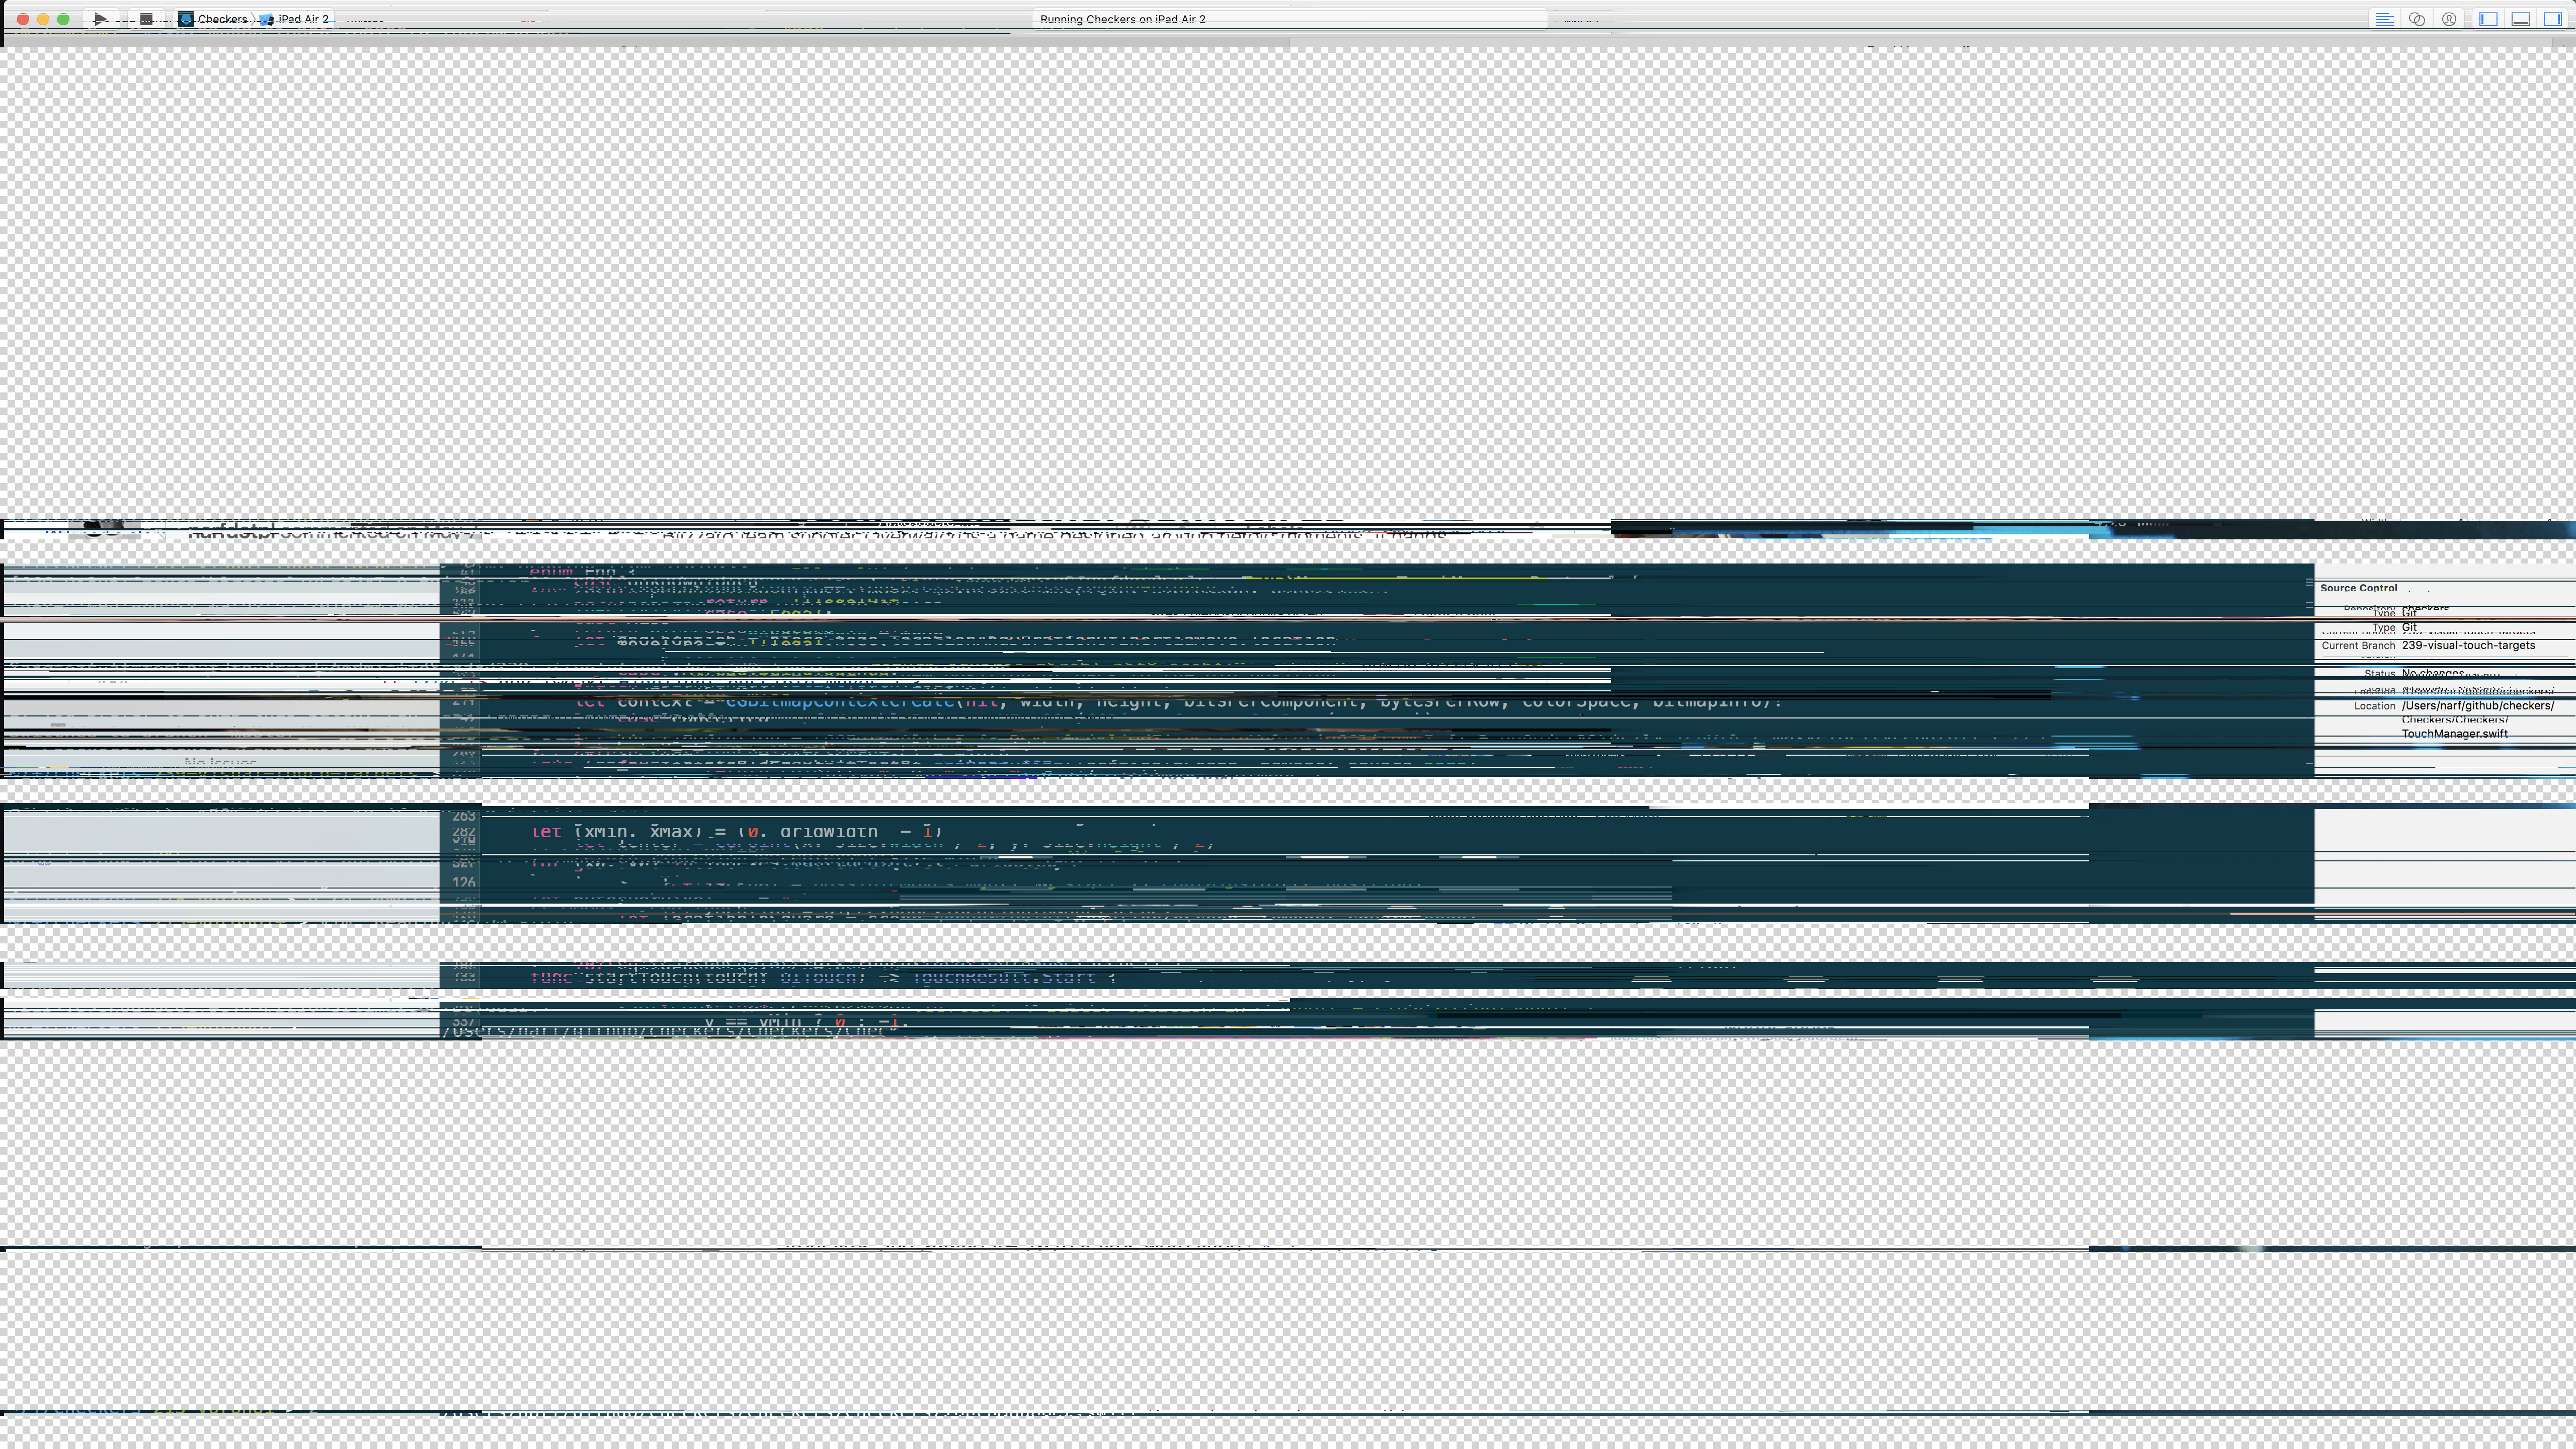
Xcode